Figure: Consumer Equilibrium I The figure shows three of Owen's indifference curves for pizza and soda per week.Owen has $180 per month to spend on the two goods, and the price of a pizza is $20 and the price of a soda is
$1) 50. 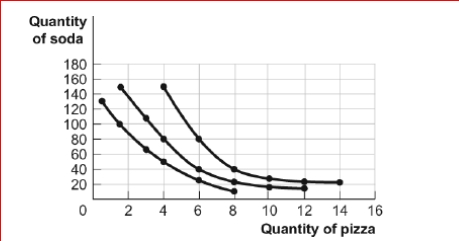
 (Figure: Consumer Equilibrium I) Look at the figure Consumer Equilibrium I.What is Owen's marginal rate of substitution of pizza in place of soda when he is consuming his optimal consumption bundle?
A) 0.75
B) 1.5
C) 13.3
D) 20
Correct Answer:
Verified
Q69: Joseph chooses a combination of apples and
Q70: Figure: Consumer Equilibrium I The figure shows
Q71: At the optimal consumption bundle, which of
Q72: Figure: The Indifference Curve Map II
Q75: Joseph chooses a combination of apples and
Q76: Figure: Consumer Equilibrium I The figure shows
Q77: After learning about indifference curves, Sandy realizes
Q78: Joseph chooses a combination of apples and
Q211: Luis is consuming his optimal consumption bundle
Q215: Joseph chooses a combination of apples and
Unlock this Answer For Free Now!
View this answer and more for free by performing one of the following actions

Scan the QR code to install the App and get 2 free unlocks

Unlock quizzes for free by uploading documents