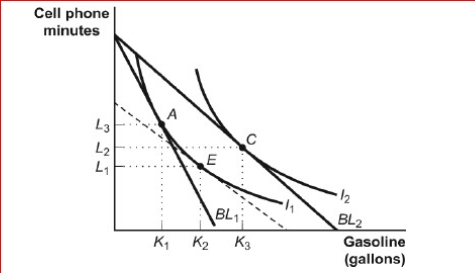
Figure: Income and Substitution Effects 
 (Figure: Income and Substitution Effects) Look at the figure Income and Substitution Effects.Carlos is originally consuming his optimal consumption bundle at point A in the figure when the price of gasoline falls.The dashed line tangent to I1 shows a hypothetical budget line reflecting:
A) the original income, original price of cell phone minutes, and the new price of gasoline.
B) the new relative prices of gasoline in terms of cell phone minutes and a change in income to keep Carlos on the original indifference curve.
C) the new relative prices of gasoline in terms of cell phone minutes and a change in income to allow Carlos to reach an indifference curve higher than I1.
D) the income and substitution effects.
Correct Answer:
Verified
Q107: Figure: Income and Substitution Effects 
Q108: Increases in the price of the good
Q110: Karen consumes gasoline and other goods.A new
Q113: Consumers buy both alcoholic and nonalcoholic beverages.If
Q114: Figure: Income and Substitution Effects
(Figure: Income and
Q115: Suppose potatoes are an inferior good and
Q116: Suppose the government decides to help poor
Q117: Figure: Income and Substitution Effects
(Figure: Income and
Q244: Decreases in the price of the good
Q246: Decreases in the price of the good
Unlock this Answer For Free Now!
View this answer and more for free by performing one of the following actions

Scan the QR code to install the App and get 2 free unlocks

Unlock quizzes for free by uploading documents