Figure: Income and Substitution Effects 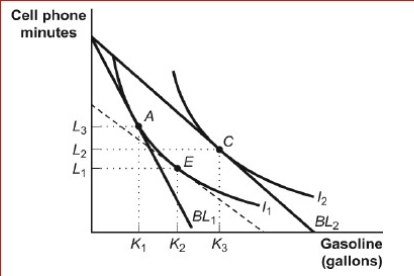
 (Figure: Income and Substitution Effects) Look at the figure Income and Substitution Effects.Carlos is originally consuming his optimal consumption bundle at point A in the figure when the price of gasoline falls.The movement from K2 to K3 reflects:
A) the total change in quantity demanded due to the decrease in the price of gasoline.
B) the income effect of the price decrease of gasoline.
C) the substitution effect of the price decrease of gasoline.
D) the income effect of the price decrease of gasoline and the substitution effect of the price decrease of gasoline.
Correct Answer:
Verified
Q102: Suppose the government decides to help poor
Q104: Suppose Frank buys only milk and cereal,
Q105: Suppose ramen is a Giffen good and
Q106: Figure: A Changing Budget Constraint for Strawberries
Q108: Increases in the price of the good
Q110: Karen consumes gasoline and other goods.A new
Q112: Figure: Income and Substitution Effects 
Q244: Decreases in the price of the good
Q246: Decreases in the price of the good
Q251: A demand curve is generated from indifference
Unlock this Answer For Free Now!
View this answer and more for free by performing one of the following actions

Scan the QR code to install the App and get 2 free unlocks

Unlock quizzes for free by uploading documents