Figure: Indifference Curves and Consumption Bundles 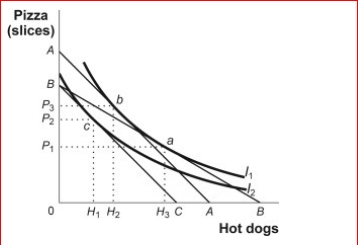
 (Figure: Indifference Curves and Consumption Bundles) Look at the figure Indifference Curves and Consumption Bundles.In the figure, the initial optimum is at a.The price of hot dogs increases, and the new equilibrium point is c.The change in hot dog consumption due to the income effect of the price change is:
A) H3 to H2.
B) H3 to H1.
C) H2 to H1.
D) H1 to H2.
Correct Answer:
Verified
Q34: A _ can be generated from indifference
Q119: Javon is consuming his optimal utility-maximizing consumption
Q120: Suppose peanut butter is an inferior good
Q121: Figure: The Optimal Consumption Bundle 
Q122: Figure: The Consumption of Video Games and
Q125: Figure: The Optimal Consumption Bundle
Q126: Figure: Harold's Indifference Curves The figure shows
Q127: Figure: The Optimal Consumption Bundle
(Figure: The Optimal
Q128: Figure: Harold's Indifference Curves The figure shows
Q190: In terms of indifference curves, a demand
Unlock this Answer For Free Now!
View this answer and more for free by performing one of the following actions

Scan the QR code to install the App and get 2 free unlocks

Unlock quizzes for free by uploading documents