Figure: Harold's Indifference Curves The figure shows three of Harold's indifference curves for bread and cheese. 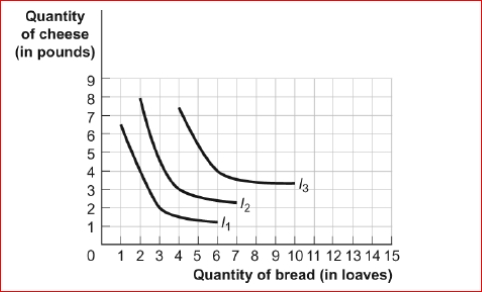
 (Figure: Harold's Indifference Curves) Look at the figure Harold's Indifference Curves.Given that the price of bread is $1 per loaf and the price of cheese is $2, as Harold's income increases from
$10 to $14, we can determine that:
A) both bread and cheese are inferior goods.
B) bread is a normal good and cheese is an inferior good.
C) bread is an inferior good and cheese is a normal good.
D) both bread and cheese are normal goods.
Correct Answer:
Verified
Q34: A _ can be generated from indifference
Q123: Figure: Indifference Curves and Consumption Bundles
Q125: Figure: The Optimal Consumption Bundle 
Q126: Figure: Harold's Indifference Curves The figure shows
Q127: Figure: The Optimal Consumption Bundle
(Figure: The Optimal
Q129: Figure: Harold's Indifference Curves The figure shows
Q130: Figure: The Optimal Consumption Bundle
Q131: Figure: Indifference Curves and Consumption Bundles
Q132: Figure: Indifference Curves and Consumption Bundles
Q133: Figure: Harold's Indifference Curves The figure shows
Unlock this Answer For Free Now!
View this answer and more for free by performing one of the following actions

Scan the QR code to install the App and get 2 free unlocks

Unlock quizzes for free by uploading documents