Figure: Indifference Curves and Consumption Bundles 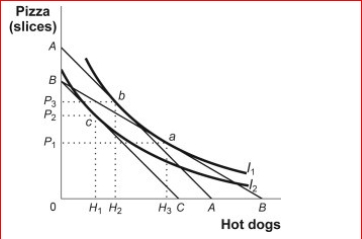
 (Figure: Indifference Curves and Consumption Bundles) Look at the figure Indifference Curves and Consumption Bundles.In the figure, the lines AA and BC are parallel.The optimal consumption point could shift from b to c as a result of any of the following except:
A) an equal percentage increase in the prices of both hot dogs and pizza while income is unchanged.
B) a decrease in income with prices constant.
C) a change in tastes.
D) an equal percentage increase in the prices of both hot dogs and pizza while income is unchanged or as a result of a decrease in income with prices constant.
Correct Answer:
Verified
Q127: Figure: The Optimal Consumption Bundle
(Figure: The Optimal
Q128: Figure: Harold's Indifference Curves The figure shows
Q129: Figure: Harold's Indifference Curves The figure shows
Q130: Figure: The Optimal Consumption Bundle 
Q131: Figure: Indifference Curves and Consumption Bundles
Q133: Figure: Harold's Indifference Curves The figure shows
Q134: Figure: The Consumption of Video Games and
Q135: Figure: The Consumption of Video Games and
Q136: Figure: The Optimal Consumption Bundle
Q137: Figure: Harold's Indifference Curves The figure shows
Unlock this Answer For Free Now!
View this answer and more for free by performing one of the following actions

Scan the QR code to install the App and get 2 free unlocks

Unlock quizzes for free by uploading documents