Figure: The Consumption of Video Games and eBooks 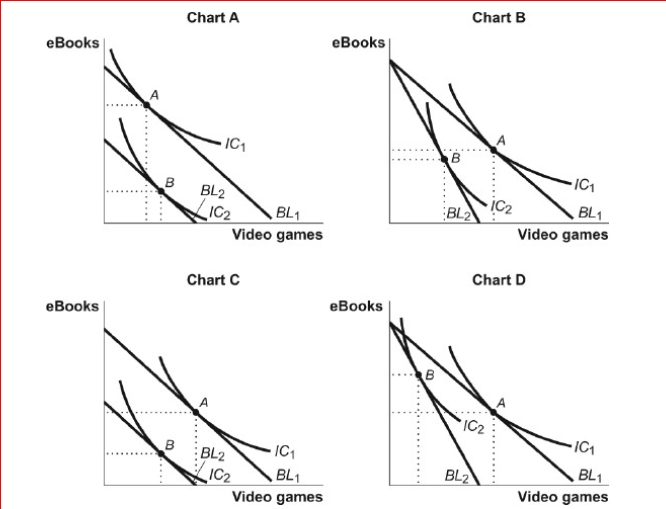
 (Figure: The Consumption of Video Games and eBooks) Look at the figure The Consumption of Video Games and eBooks.Which chart in the figure shows the effects of a decrease in income when video games are an inferior good and eBooks are a normal good?
A) A
B) B
C) C
D) D
Correct Answer:
Verified
Q130: Figure: The Optimal Consumption Bundle 
Q131: Figure: Indifference Curves and Consumption Bundles
Q132: Figure: Indifference Curves and Consumption Bundles
Q133: Figure: Harold's Indifference Curves The figure shows
Q134: Figure: The Consumption of Video Games and
Q136: Figure: The Optimal Consumption Bundle
Q137: Figure: Harold's Indifference Curves The figure shows
Q138: Figure: Indifference Curves and Consumption Bundles
Q139: Figure: Harold's Indifference Curves The figure shows
Q140: Figure: The Optimal Consumption Bundle
Unlock this Answer For Free Now!
View this answer and more for free by performing one of the following actions

Scan the QR code to install the App and get 2 free unlocks

Unlock quizzes for free by uploading documents