Figure: The Optimal Consumption Bundle 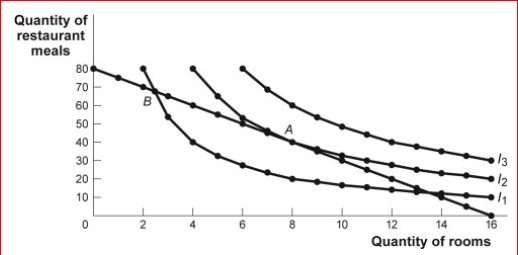
 (Figure: The Optimal Consumption Bundle) Look at the figure The Optimal Consumption Bundle.In
The figure, which of the following could lead to an optimal consumption bundle on indifference curve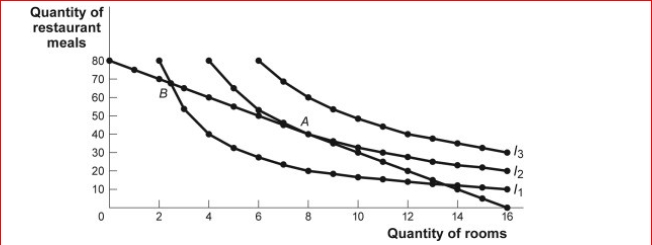 I1?
I1?
A) an increase in income
B) a decrease in the price of restaurant meals
C) a decrease in the price of rooms
D) a decrease in income
Correct Answer:
Verified
Q131: Figure: Indifference Curves and Consumption Bundles
Q132: Figure: Indifference Curves and Consumption Bundles
Q133: Figure: Harold's Indifference Curves The figure shows
Q134: Figure: The Consumption of Video Games and
Q135: Figure: The Consumption of Video Games and
Q137: Figure: Harold's Indifference Curves The figure shows
Q138: Figure: Indifference Curves and Consumption Bundles
Q139: Figure: Harold's Indifference Curves The figure shows
Q140: Figure: The Optimal Consumption Bundle 
Q141: Figure and Table: The Changing Slope of
Unlock this Answer For Free Now!
View this answer and more for free by performing one of the following actions

Scan the QR code to install the App and get 2 free unlocks

Unlock quizzes for free by uploading documents