Figure: Indifference Curves and Consumption Bundles 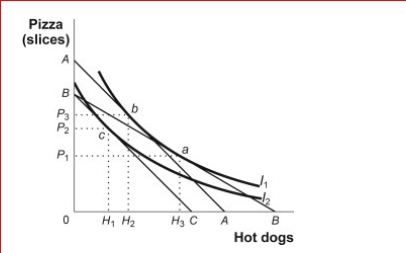
 (Figure: Indifference Curves and Consumption Bundles) Look at the figure Indifference Curves and Consumption Bundles.In the figure, the initial optimum is at a.The price of hot dogs now increases.The change in hot dog consumption due to the substitution effect is:
A) H3 to H2.
B) H3 to H1.
C) H2 to H1.
D) H1 to H2.
Correct Answer:
Verified
Q133: Figure: Harold's Indifference Curves The figure shows
Q134: Figure: The Consumption of Video Games and
Q135: Figure: The Consumption of Video Games and
Q136: Figure: The Optimal Consumption Bundle 
Q137: Figure: Harold's Indifference Curves The figure shows
Q139: Figure: Harold's Indifference Curves The figure shows
Q140: Figure: The Optimal Consumption Bundle
Q141: Figure and Table: The Changing Slope of
Q142: Figure: Consumer Equilibrium III
(Figure: Consumer Equilibrium III)
Q143: Figure: Consumer Equilibrium III ![]()
Unlock this Answer For Free Now!
View this answer and more for free by performing one of the following actions

Scan the QR code to install the App and get 2 free unlocks

Unlock quizzes for free by uploading documents