Figure and Table: The Changing Slope of an Indifference Curve 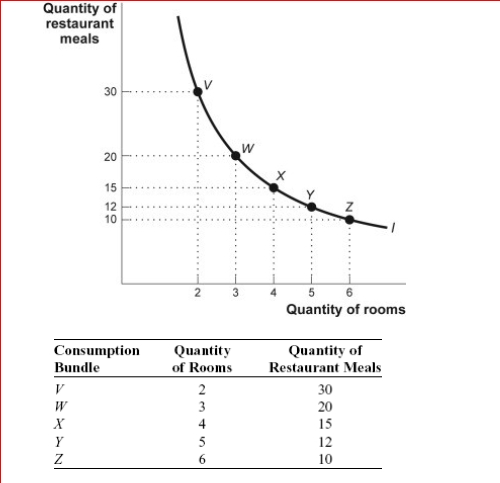
 (Figure and Table: The Changing Slope of an Indifference Curve) Look at the figure and table The Changing Slope of an Indifference Curve.The slope between points W and X in the accompanying figure is:
A) 5.
B) -5.
C) 1/5.
D) -1/5.
Correct Answer:
Verified
Q150: Figure: Consumer Equilibrium III
(Figure: Consumer Equilibrium III)
Q151: Figure: Consumer Equilibrium III Q152: Figure and Table: The Changing Slope of Q153: Figure: Consumer Equilibrium IV Q154: Figure: Consumer Equilibrium II Q156: Figure: Consumer Equilibrium III Q157: Figure: Consumer Equilibrium II Q158: Figure: Consumer Equilibrium IV Q159: Figure: Consumer Equilibrium III Q160: Figure: Consumer Equilibrium II Unlock this Answer For Free Now! View this answer and more for free by performing one of the following actions Scan the QR code to install the App and get 2 free unlocks Unlock quizzes for free by uploading documents![]()
![]()
![]()
(Figure: Consumer Equilibrium III)![]()
![]()
![]()
![]()

