Figure: Consumer Equilibrium II 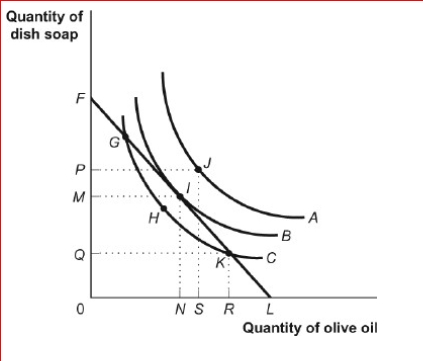
 (Figure: Consumer Equilibrium II) Look at the figure Consumer Equilibrium II.The lowest level of total utility shown in the figure is associated with point ________ on curve _.
A) H; A
B) I; B
C) G; C
D) J; A
Correct Answer:
Verified
Q155: Figure and Table: The Changing Slope of
Q156: Figure: Consumer Equilibrium III
(Figure: Consumer Equilibrium III)
Q157: Figure: Consumer Equilibrium II Q158: Figure: Consumer Equilibrium IV Q159: Figure: Consumer Equilibrium III Q161: At the video store, Lucian narrows his Unlock this Answer For Free Now! View this answer and more for free by performing one of the following actions Scan the QR code to install the App and get 2 free unlocks Unlock quizzes for free by uploading documents![]()
![]()
![]()

