Consider the following graph. 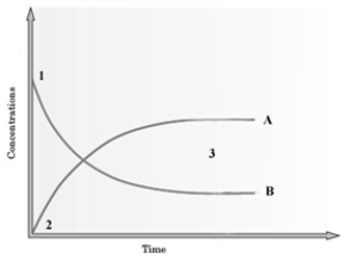 The graph is based on data collected from the following reaction.
  Which curve on the graph represents the change in concentration of CH3COOC2H5 for the forward reaction?
A) A
B) B
C) It is not possible to show the production of water.
Correct Answer:
Verified
Q94: What is the effect of adding CH3COOH(g)
Q95: If the exothermic reaction Q96: For the exothermic reaction Q97: Which of the following is the equilibrium Q98: For the exothermic reaction Q99: Consider the following energy diagram for a Q100: Consider the following energy diagram for a Q101: In the reaction of HCl with water: Q103: Consider the following graph. Q104: Consider the following graph. Unlock this Answer For Free Now! View this answer and more for free by performing one of the following actions Scan the QR code to install the App and get 2 free unlocks Unlock quizzes for free by uploading documents![]()
![]()
![]()
![]()
![]()

