Map: Size of Slaveholdings, 1860
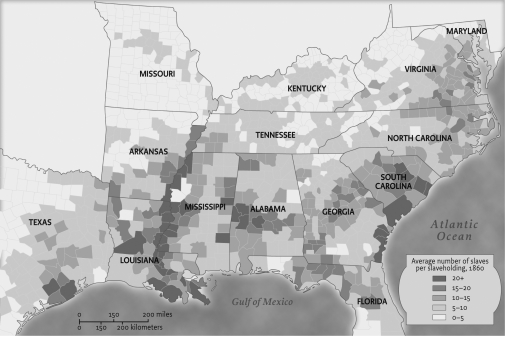
-Which of the following was the most significant cause of the trend depicted in the map?
A) Antislavery advocates in the east were pushing slavery westward.
B) the lack of political attempts to limit the expansion of slavery
C) The growth in the slave population led to its westward expansion.
D) Overcultivation depleted arable land in the Southeast.
Correct Answer:
Verified
Q2: On the eve of the Civil War,
Q3: In 1850, a majority of southern slaveholders
Q4: What economic effect did southern slavery have
Q5: What was true of the South and
Q6: The internal slave trade in the United
Q7: Map: Size of Slaveholdings, 1860

Q8: The relationship between rich southern planters and
Q9: Frederick Douglass argued that:
A) slaves were truer
Q10: The U.S. slave population by 1860 was
Q11: Southern farmers in the backcountry:
A) generally worked
Unlock this Answer For Free Now!
View this answer and more for free by performing one of the following actions

Scan the QR code to install the App and get 2 free unlocks

Unlock quizzes for free by uploading documents