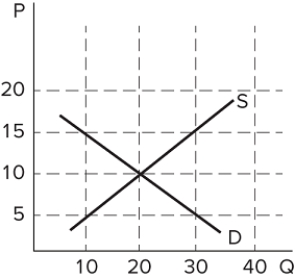
The graph shown depicts the market for a good. At a price of $5, there is:
A) a shortage (excess demand) of 10 units. B) a shortage (excess demand) of 20 units. C) a shortage (excess demand) of 30 units. D) a surplus (excess supply) of 20 units.
Correct Answer:
Verified
Unlock this answer now Get Access to more Verified Answers free of charge
 The graph shown depicts the market for a good. At a price of $5, there is:
