Multiple Choice
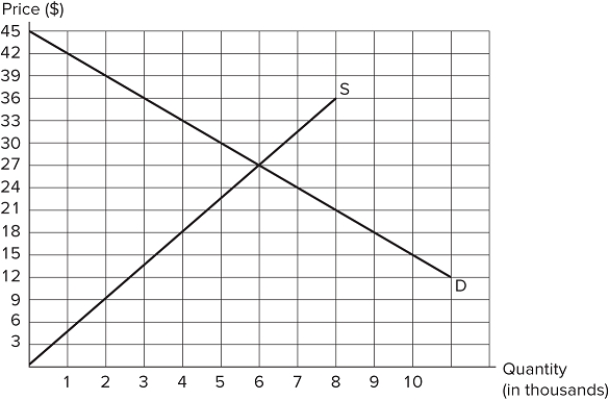 The graph shown depicts the market for a good. At a price of $18, there is:
A) a shortage (excess demand) of 9,000 units.
B) a shortage (excess demand) of 5,000 units.
C) a shortage (excess demand) of 4,000 units.
D) a surplus (excess supply) of 5,000 units.
Correct Answer:
Verified
Related Questions

