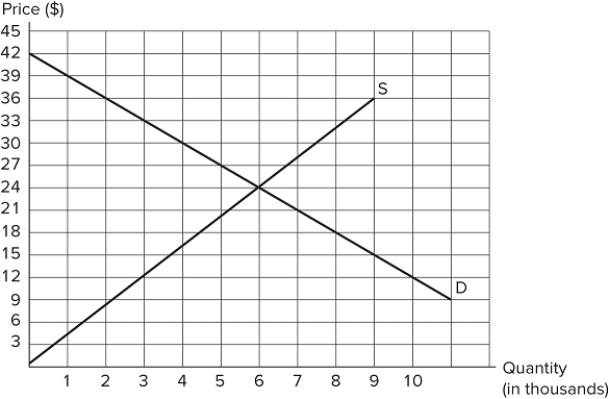
 The graph shown depicts the market for a good. At a price of $12, there is:
A) a surplus (excess supply) of 10,000 units.
B) a shortage (excess demand) of 10,000 units.
C) a shortage (excess demand) of 7,000 units.
D) a surplus (excess supply) of 3,000 units.
Correct Answer:
Verified
Q143: Consider a market that is in equilibrium.
Q146: Consider a market that is in equilibrium.
Q147: Suppose there is an unusually large crop
Q148: Q149: Consider a market that is in equilibrium. Q152: Consider a market that is in equilibrium. Q153: Suppose the price of oil has recently![]()
Unlock this Answer For Free Now!
View this answer and more for free by performing one of the following actions

Scan the QR code to install the App and get 2 free unlocks

Unlock quizzes for free by uploading documents