Multiple Choice
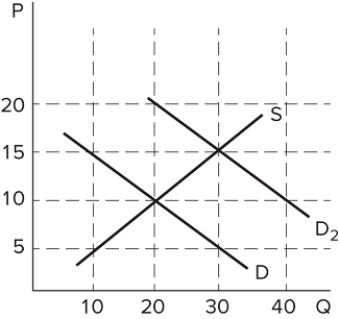 The graph shown depicts the market for a good. Assume the market was originally in equilibrium where the demand curve (D) and supply curve (S) intersect. What was the original equilibrium price and quantity for this good?
A) $5 and 30
B) $5 and 20
C) $10 and 20
D) $20 and 10
Correct Answer:
Verified
Related Questions
Q144: Suppose the price of oil has recently
Q146: Consider a market that is in equilibrium.
Q147: Suppose there is an unusually large crop
Q149: Consider a market that is in equilibrium.
Q152: Consider a market that is in equilibrium.
Unlock this Answer For Free Now!
View this answer and more for free by performing one of the following actions

Scan the QR code to install the App and get 2 free unlocks

Unlock quizzes for free by uploading documents