The graph shown displays a Lorenz curve. 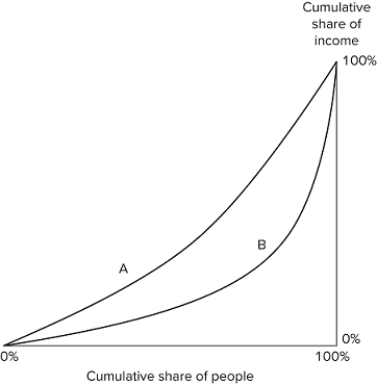 Which of the following statements is true? The midpoint of each line demonstrates the area with least inequality.Curve A demonstrates a more equal society than curve B.On both curves, individuals in the 99th percentile of the income distribution earn more than 1 percent of the total income.
A) I only
B) II and III only
C) I and III only
D) I, II, and III
Correct Answer:
Verified
Q63: The Gini coefficient measures:
A)income inequality.
B)poverty prevalence.
C)average income
Q64: The Lorenz curve maps:
A)the cumulative percentage of
Q65: The graph shown displays the Lorenz curve
Q66: A Gini coefficient of zero indicates:
A)no income
Q67: The graph shown displays a Lorenz curve.
Q69: The global pattern of inequality has:
A)remained surprisingly
Q70: The Gini coefficient is calculated by measuring
Q71: A perfectly straight Lorenz curve would indicate
Q72: The graph shown displays the Lorenz curves
Q73: Which graph summarizes inequality visually?
A)Laffer curve
B)Income inequality
Unlock this Answer For Free Now!
View this answer and more for free by performing one of the following actions

Scan the QR code to install the App and get 2 free unlocks

Unlock quizzes for free by uploading documents