The graph shown demonstrates the domestic demand and supply for a good, as well as a quota and the world price for that good. 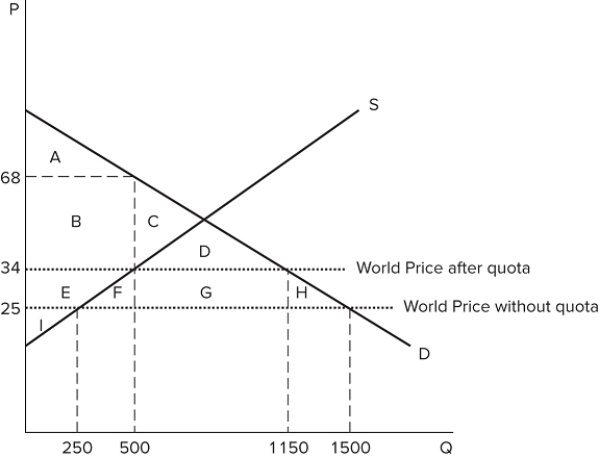 If this economy's government imposes the quota, consumer surplus will:
A) decrease by areas E + F + G + H.
B) increase by areas E + F + G + H.
C) decrease by areas F + G.
D) increase by areas A + B + C + D.
Correct Answer:
Verified
Q135: The graph shown demonstrates the domestic demand
Q136: The graph shown demonstrates the domestic demand
Q137: The graph shown demonstrates the domestic demand
Q138: The graph shown demonstrates the domestic demand
Q139: The graph shown demonstrates the domestic demand
Q141: The problem of inconsistent standards across nations
Q142: Import standards on specific countries usually address
Q143: The policies that different governments use to
Q144: Blanket standards on imports usually address issues
Q145: Import standards on specific countries are _
Unlock this Answer For Free Now!
View this answer and more for free by performing one of the following actions

Scan the QR code to install the App and get 2 free unlocks

Unlock quizzes for free by uploading documents