The graph shown demonstrates the domestic demand and supply for a good, as well as a quota and the world price for that good. 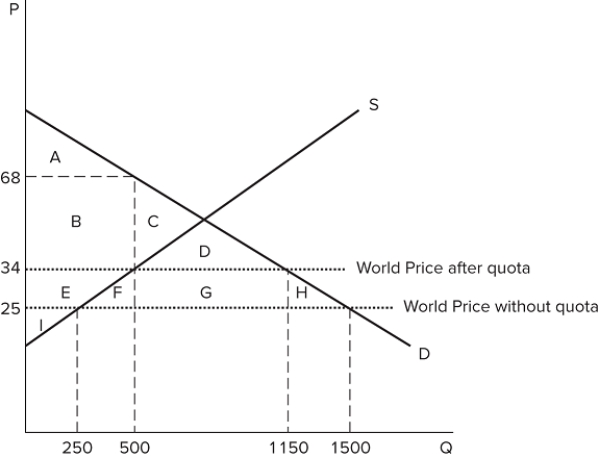 If the economy opens itself to free trade, producer surplus will:
A) decrease to area I.
B) decrease to areas E + I.
C) increase to areas E + I.
D) increase to areas A + B + C + D + E + F + G + H.
Correct Answer:
Verified
Q130: The graph shown demonstrates the domestic demand
Q131: The graph shown demonstrates the domestic demand
Q132: In general, one of the results of
Q133: The graph shown demonstrates the domestic demand
Q134: The graph shown demonstrates the domestic demand
Q136: The graph shown demonstrates the domestic demand
Q137: The graph shown demonstrates the domestic demand
Q138: The graph shown demonstrates the domestic demand
Q139: The graph shown demonstrates the domestic demand
Q140: The graph shown demonstrates the domestic demand
Unlock this Answer For Free Now!
View this answer and more for free by performing one of the following actions

Scan the QR code to install the App and get 2 free unlocks

Unlock quizzes for free by uploading documents