The graph shown displays the cost and revenue curves associated with a monopolistically competitive firm. 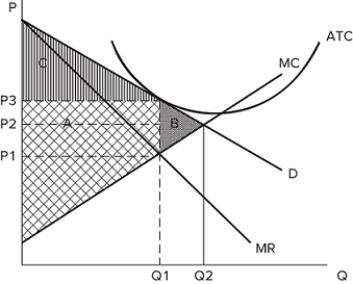 Producing Q2 and charging P2:
A) represents the perfectly competitive outcome.
B) is an efficient outcome.
C) is an outcome that eliminates deadweight loss.
D) All of these are true.
Correct Answer:
Verified
Q77: If the demand curve for a firm
Q78: If firms in a monopolistically competitive market
Q79: The graph shown displays the cost and
Q80: If the demand curve for a firm
Q81: Monopolistically competitive firms have an incentive to:
A)attempt
Q83: In the long run, firms in a
Q84: The process of entry and exit into
Q85: How can monopolistically competitive firms earn profits
Q86: In the long run, firms in a
Q87: Why is it difficult to regulate a
Unlock this Answer For Free Now!
View this answer and more for free by performing one of the following actions

Scan the QR code to install the App and get 2 free unlocks

Unlock quizzes for free by uploading documents