The graph shown displays the cost and revenue curves associated with a monopolistically competitive firm. 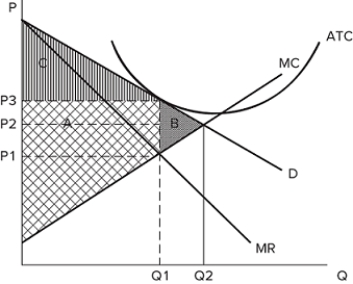 If the firm is producing Q1 and charging P3, it is likely:
A) in long run equilibrium.
B) at an efficient outcome.
C) not maximizing profits.
D) operating at a loss.
Correct Answer:
Verified
Q74: If the demand curve for a firm
Q75: The graph shown displays the cost and
Q76: If firms in a monopolistically competitive market
Q77: If the demand curve for a firm
Q78: If firms in a monopolistically competitive market
Q80: If the demand curve for a firm
Q81: Monopolistically competitive firms have an incentive to:
A)attempt
Q82: The graph shown displays the cost and
Q83: In the long run, firms in a
Q84: The process of entry and exit into
Unlock this Answer For Free Now!
View this answer and more for free by performing one of the following actions

Scan the QR code to install the App and get 2 free unlocks

Unlock quizzes for free by uploading documents