The graph shown displays the cost and revenue curves associated with a monopolistically competitive firm. 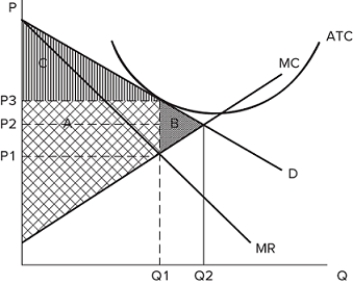 If the firm produces Q2 and charges P2, then:
A) economic profit will be negative.
B) deadweight loss will be positive.
C) producer surplus will be zero.
D) profits will be maximized.
Correct Answer:
Verified
Q70: The graph shown displays the cost and
Q71: The graph shown displays the cost and
Q72: The graph shown displays the cost and
Q73: If a monopolistically competitive firm's demand curve
Q74: If the demand curve for a firm
Q76: If firms in a monopolistically competitive market
Q77: If the demand curve for a firm
Q78: If firms in a monopolistically competitive market
Q79: The graph shown displays the cost and
Q80: If the demand curve for a firm
Unlock this Answer For Free Now!
View this answer and more for free by performing one of the following actions

Scan the QR code to install the App and get 2 free unlocks

Unlock quizzes for free by uploading documents