The graph shown displays the cost and revenue curves associated with a monopolistically competitive firm. 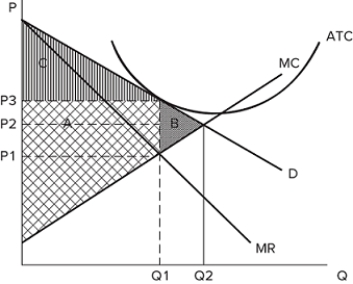 If the firm is producing Q1 and charging P3, it is likely:
A) earning positive economic profits.
B) earning negative economic profits.
C) in long run equilibrium.
D) All of these are true.
Correct Answer:
Verified
Q67: The graph shown displays the cost and
Q68: The graph shown displays the cost and
Q69: The graph shown displays the cost and
Q70: The graph shown displays the cost and
Q71: The graph shown displays the cost and
Q73: If a monopolistically competitive firm's demand curve
Q74: If the demand curve for a firm
Q75: The graph shown displays the cost and
Q76: If firms in a monopolistically competitive market
Q77: If the demand curve for a firm
Unlock this Answer For Free Now!
View this answer and more for free by performing one of the following actions

Scan the QR code to install the App and get 2 free unlocks

Unlock quizzes for free by uploading documents