The graph shown displays the cost and revenue curves associated with a monopolistically competitive firm. 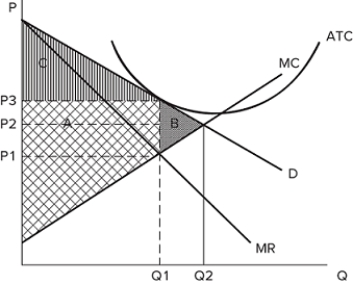 If the firm is producing Q1 and charging P3, it is likely:
A) earning positive economic profits.
B) earning negative economic profits.
C) earning zero economic profits.
D) It is impossible to know the profits the firm is earning from the graph provided.
Correct Answer:
Verified
Q62: The graph shown displays the cost and
Q63: If a monopolistically competitive firm's demand curve
Q64: The graph shown displays the cost and
Q65: Which of the following would cause the
Q66: If a monopolistically competitive firm's demand curve
Q68: The graph shown displays the cost and
Q69: The graph shown displays the cost and
Q70: The graph shown displays the cost and
Q71: The graph shown displays the cost and
Q72: The graph shown displays the cost and
Unlock this Answer For Free Now!
View this answer and more for free by performing one of the following actions

Scan the QR code to install the App and get 2 free unlocks

Unlock quizzes for free by uploading documents