The graph shown displays the cost and revenue curves associated with a monopolistically competitive firm. 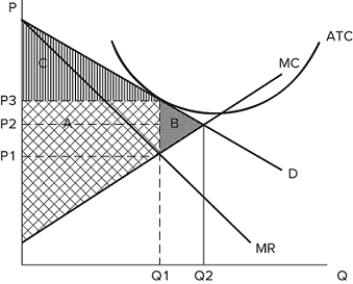 If the firm is producing Q1 and charging P3, this graph likely shows the firm's cost and revenue curves in the:
A) long run, and economic profits are zero.
B) short run, and accounting profits are negative.
C) long run, and accounting profits are zero.
D) short run, and economic profits are positive.
Correct Answer:
Verified
Q57: Firms are incentivized to enter a monopolistically
Q58: For the monopolistically competitive firm, the demand
Q59: If a monopolistically competitive firm is suffering
Q60: In the short run, a monopolistically competitive
Q61: The graph shown displays the cost and
Q63: If a monopolistically competitive firm's demand curve
Q64: The graph shown displays the cost and
Q65: Which of the following would cause the
Q66: If a monopolistically competitive firm's demand curve
Q67: The graph shown displays the cost and
Unlock this Answer For Free Now!
View this answer and more for free by performing one of the following actions

Scan the QR code to install the App and get 2 free unlocks

Unlock quizzes for free by uploading documents