The graph shown displays the cost and revenue curves associated with a monopolistically competitive firm. 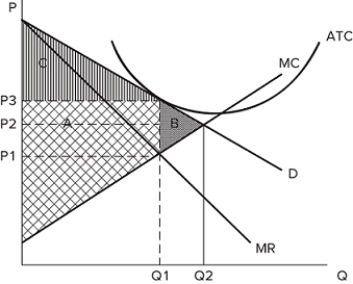 If the firm produces Q1 and charges P3, then area C represents:
A) producer surplus.
B) consumer surplus.
C) deadweight loss.
D) profits.
Correct Answer:
Verified
Q59: If a monopolistically competitive firm is suffering
Q60: In the short run, a monopolistically competitive
Q61: The graph shown displays the cost and
Q62: The graph shown displays the cost and
Q63: If a monopolistically competitive firm's demand curve
Q65: Which of the following would cause the
Q66: If a monopolistically competitive firm's demand curve
Q67: The graph shown displays the cost and
Q68: The graph shown displays the cost and
Q69: The graph shown displays the cost and
Unlock this Answer For Free Now!
View this answer and more for free by performing one of the following actions

Scan the QR code to install the App and get 2 free unlocks

Unlock quizzes for free by uploading documents