The graph shown displays the cost and revenue curves associated with a monopolistically competitive firm. 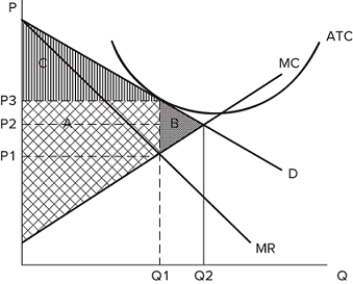 If the firm is producing Q1 and charging P3, this graph likely shows the firm's cost and revenue curves in the:
A) short run, and firms will enter this market.
B) long run, and firms will enter this market.
C) short run, and firms will leave this market.
D) long run, and no firms will enter or exit this market.
Correct Answer:
Verified
Q65: Which of the following would cause the
Q66: If a monopolistically competitive firm's demand curve
Q67: The graph shown displays the cost and
Q68: The graph shown displays the cost and
Q69: The graph shown displays the cost and
Q71: The graph shown displays the cost and
Q72: The graph shown displays the cost and
Q73: If a monopolistically competitive firm's demand curve
Q74: If the demand curve for a firm
Q75: The graph shown displays the cost and
Unlock this Answer For Free Now!
View this answer and more for free by performing one of the following actions

Scan the QR code to install the App and get 2 free unlocks

Unlock quizzes for free by uploading documents