The graph shown represents the cost and revenue curves faced by a monopoly. 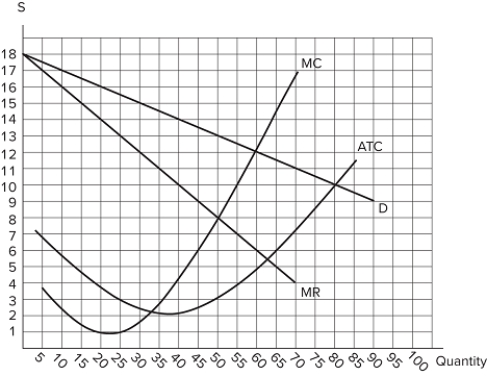 What is the deadweight loss in this market?
A) $0
B) $25
C) $70
D) $150
Correct Answer:
Verified
Q98: The graph shown represents the cost and
Q99: The equilibrium price and quantity in a
Q100: This graph shows the cost and revenue
Q101: Public policy responses to monopolies:
A)aim to break
Q102: Economists assume maximizing efficiency over other goals:
A)is
Q104: The monopolist's outcome happens at a _
Q105: Some economists argue the best response to
Q106: With a monopolist's outcome, total surplus is
Q107: Which of the following is an example
Q108: The monopolist chooses to produce:
A)where marginal cost
Unlock this Answer For Free Now!
View this answer and more for free by performing one of the following actions

Scan the QR code to install the App and get 2 free unlocks

Unlock quizzes for free by uploading documents