This graph shows the cost and revenue curves faced by a monopoly. 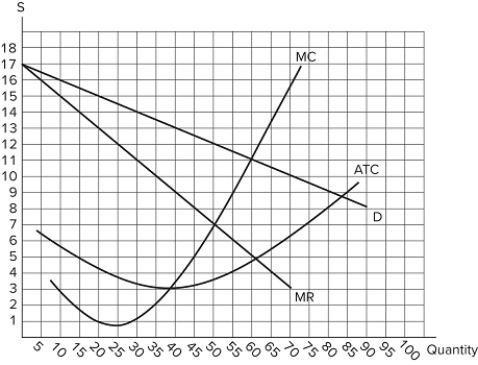 The profit-maximizing price is:
A) $3
B) $7
C) $11
D) $12
Correct Answer:
Verified
Q95: The existence of a monopoly:
A)creates market inefficiencies.
B)causes
Q96: The graph shown represents the cost and
Q97: For markets operating at quantities lower than
Q98: The graph shown represents the cost and
Q99: The equilibrium price and quantity in a
Q101: Public policy responses to monopolies:
A)aim to break
Q102: Economists assume maximizing efficiency over other goals:
A)is
Q103: The graph shown represents the cost and
Q104: The monopolist's outcome happens at a _
Q105: Some economists argue the best response to
Unlock this Answer For Free Now!
View this answer and more for free by performing one of the following actions

Scan the QR code to install the App and get 2 free unlocks

Unlock quizzes for free by uploading documents