The graph shown represents the cost and revenue curves faced by a monopoly. 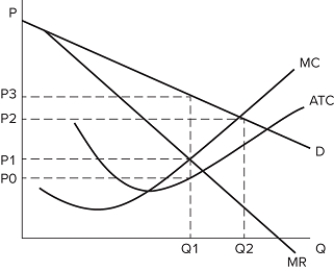 If Q2 units are being produced, the monopolist:
A) is not maximizing profits.
B) is producing where marginal costs are less than marginal revenue.
C) is earning negative profits.
D) should increase production.
Correct Answer:
Verified
Q91: Public policies designed to mitigate the effects
Q92: The existence of a monopoly:increases total surplus.increases
Q93: The graph shown represents the cost and
Q94: The graph shown represents the cost and
Q95: The existence of a monopoly:
A)creates market inefficiencies.
B)causes
Q97: For markets operating at quantities lower than
Q98: The graph shown represents the cost and
Q99: The equilibrium price and quantity in a
Q100: This graph shows the cost and revenue
Q101: Public policy responses to monopolies:
A)aim to break
Unlock this Answer For Free Now!
View this answer and more for free by performing one of the following actions

Scan the QR code to install the App and get 2 free unlocks

Unlock quizzes for free by uploading documents