The graph shown represents the cost and revenue curves faced by a monopoly. 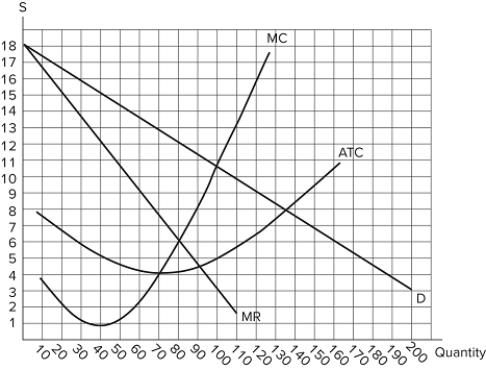 Which of the following statements is true?The monopolist's profit maximizing price is $12.The monopolist's profit maximizing quantity is 100.The monopolist will earn zero profits.
A) II only
B) I and III only
C) I only
D) II, and III only
Correct Answer:
Verified
Q89: The graph shown represents the cost and
Q90: The graph shown represents the cost and
Q91: Public policies designed to mitigate the effects
Q92: The existence of a monopoly:increases total surplus.increases
Q93: The graph shown represents the cost and
Q95: The existence of a monopoly:
A)creates market inefficiencies.
B)causes
Q96: The graph shown represents the cost and
Q97: For markets operating at quantities lower than
Q98: The graph shown represents the cost and
Q99: The equilibrium price and quantity in a
Unlock this Answer For Free Now!
View this answer and more for free by performing one of the following actions

Scan the QR code to install the App and get 2 free unlocks

Unlock quizzes for free by uploading documents