The graph shown represents the cost and revenue curves faced by a monopoly. 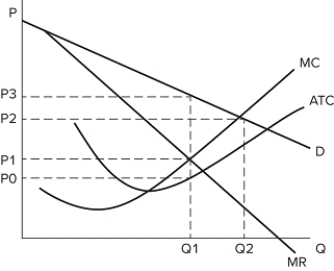 What profit is the monopolist earning?
A) (P3 − P0) × Q1
B) (P3− P1) × Q1
C) (P1− P0) × Q1
D) (P3− P0) / Q1
Correct Answer:
Verified
Q88: The graph shown represents the cost and
Q89: The graph shown represents the cost and
Q90: The graph shown represents the cost and
Q91: Public policies designed to mitigate the effects
Q92: The existence of a monopoly:increases total surplus.increases
Q94: The graph shown represents the cost and
Q95: The existence of a monopoly:
A)creates market inefficiencies.
B)causes
Q96: The graph shown represents the cost and
Q97: For markets operating at quantities lower than
Q98: The graph shown represents the cost and
Unlock this Answer For Free Now!
View this answer and more for free by performing one of the following actions

Scan the QR code to install the App and get 2 free unlocks

Unlock quizzes for free by uploading documents