The graph shown represents the cost and revenue curves faced by a monopoly. 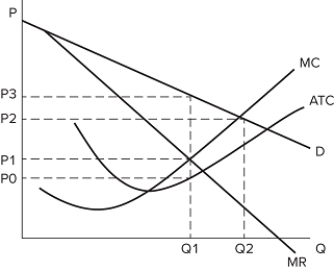 Which of the following statements is true?The outcome in a monopoly market would be Q1, P1.The outcome in a perfectly competitive market would be Q2, P2.The efficient outcome is Q2, P2.
A) I and II only
B) I only
C) II and III only
D) I, II, and III
Correct Answer:
Verified
Q85: What is one reason a firm may
Q86: The graph shown represents the cost and
Q87: This graph shows the cost and revenue
Q88: The graph shown represents the cost and
Q89: The graph shown represents the cost and
Q91: Public policies designed to mitigate the effects
Q92: The existence of a monopoly:increases total surplus.increases
Q93: The graph shown represents the cost and
Q94: The graph shown represents the cost and
Q95: The existence of a monopoly:
A)creates market inefficiencies.
B)causes
Unlock this Answer For Free Now!
View this answer and more for free by performing one of the following actions

Scan the QR code to install the App and get 2 free unlocks

Unlock quizzes for free by uploading documents