The graph shown represents the cost and revenue curves faced by a monopoly. 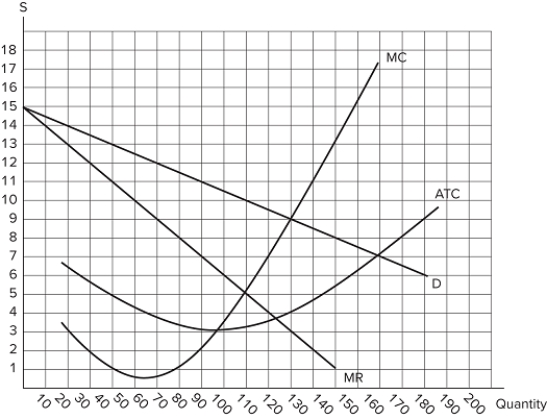 If 120 units are being produced, the monopolist:
A) could increase profits by decreasing production.
B) is maximizing its profits.
C) is earning negative profits.
D) could increase profits by increasing production.
Correct Answer:
Verified
Q84: The graph shown represents the cost and
Q85: What is one reason a firm may
Q86: The graph shown represents the cost and
Q87: This graph shows the cost and revenue
Q88: The graph shown represents the cost and
Q90: The graph shown represents the cost and
Q91: Public policies designed to mitigate the effects
Q92: The existence of a monopoly:increases total surplus.increases
Q93: The graph shown represents the cost and
Q94: The graph shown represents the cost and
Unlock this Answer For Free Now!
View this answer and more for free by performing one of the following actions

Scan the QR code to install the App and get 2 free unlocks

Unlock quizzes for free by uploading documents