The graph shown displays the marginal cost and marginal revenue curves for a perfectly competitive firm. 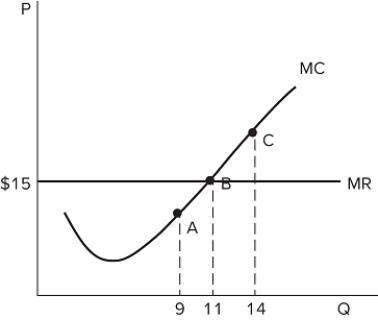 According to the graph shown, the firm earns _______ profits at point C than at point B, so the firm should _______ production.
A) higher; increase
B) lower; increase
C) lower; decrease
D) higher; decrease
Correct Answer:
Verified
Q69: The marginal cost of a firm:
A)crosses total
Q70: As long as the market price remains
Q71: For a firm in a perfectly competitive
Q72: The table shown displays the total costs
Q73: The table shown displays the total costs
Q75: The table shown displays the total costs
Q76: <p><b><b><span style="font-size:20pt;"><span style="color:#FF0000;"> Q77: The graph shown displays the marginal cost Q78: The table shown displays the total costs Q79: <p><b><b><span style="font-size:20pt;"><span style="color:#FF0000;"> ![]()
![]()
Unlock this Answer For Free Now!
View this answer and more for free by performing one of the following actions

Scan the QR code to install the App and get 2 free unlocks

Unlock quizzes for free by uploading documents