≪p><b><b><span Style="font-Size:20pt;"><span Style="color:#FF0000;"> the Graph Shown Displays the Marginal
<p><b><b><span style="font-size:20pt;"><span style="color:#FF0000;"> 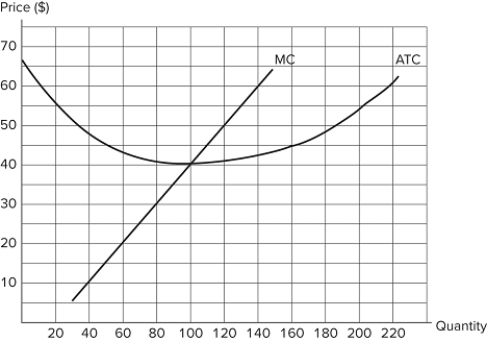 The graph shown displays the marginal cost and average total cost curves for a perfectly competitive firm. If marginal revenue equals $50, producing 140 units: is not as profitable as producing 120 units.will earn the firm negative profits.will earn more revenue than producing 100 units.
A) I only
B) II and III only
C) I and III only
D) I, II, and III
Correct Answer:
Verified
Q74: The graph shown displays the marginal cost
Q75: The table shown displays the total costs
Q76: <p><b><b><span style="font-size:20pt;"><span style="color:#FF0000;"> Q77: The graph shown displays the marginal cost Q78: The table shown displays the total costs Q80: The table shown displays the total costs Q81: Given the shutdown rule, the firm's short Q82: In the short run, a firm that Q83: In the short run, a firm must Q84: If the market price drops below a![]()
Unlock this Answer For Free Now!
View this answer and more for free by performing one of the following actions

Scan the QR code to install the App and get 2 free unlocks

Unlock quizzes for free by uploading documents