Use the following to answer questions:
Figure: The Demand Curve for Crossings 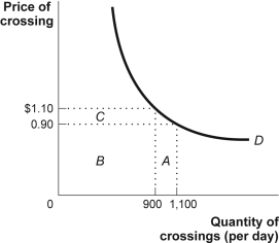
-(Figure: The Demand Curve for Bridge Crossings) Look at the figure The Demand Curve for Bridge Crossings. By the midpoint method, the price elasticity of demand between $0.90 and $1.10 in the figure is _____, since the price elasticity is _____.
A) price-elastic; less than 1
B) price unit-elastic; equal to 1
C) price-elastic; a negative number
D) price-inelastic; less than 1
Correct Answer:
Verified
Q196: If the price elasticity of supply is
Q197: Use the following to answer questions:
Figure: Supply
Q198: The price elasticity of supply measures:
A) the
Q199: For a normal good, the income elasticity
Q200: Paolo owns a pizza shop. The price
Q202: Use the following to answer questions:
Figure: The
Q203: Use the following to answer questions:
Figure: The
Q204: In the short run, the price elasticity
Q205: Use the following to answer questions:
Figure: The
Q206: Supply curves tend to be more _
Unlock this Answer For Free Now!
View this answer and more for free by performing one of the following actions

Scan the QR code to install the App and get 2 free unlocks

Unlock quizzes for free by uploading documents