Use the following to answer questions:
Figure: The Demand Curve for Oil 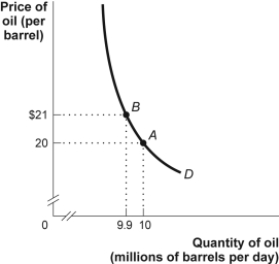
-(Figure: The Demand Curve for Oil) Look at the figure The Demand Curve for Oil. The price elasticity of demand between $20 and $21, by the midpoint method, is approximately:
A) 0.21.
B) 0.49.
C) 2.1.
D) 4.9.
Correct Answer:
Verified
Q142: Use the following to answer question:
Q198: The price elasticity of supply measures:
A) the
Q199: For a normal good, the income elasticity
Q200: Paolo owns a pizza shop. The price
Q201: Use the following to answer questions:
Figure: The
Q202: Use the following to answer questions:
Figure: The
Q204: In the short run, the price elasticity
Q205: Use the following to answer questions:
Figure: The
Q206: Supply curves tend to be more _
Q208: Use the following to answer questions:
Figure: The
Unlock this Answer For Free Now!
View this answer and more for free by performing one of the following actions

Scan the QR code to install the App and get 2 free unlocks

Unlock quizzes for free by uploading documents