
Use the graph to answer the following question.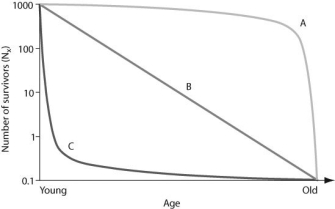
In the figure, which of the following survivorship curves most applies to humans living in developed countries?
A) curve A
B) curve B
C) curve C
D) curve A or curve B
Correct Answer:
Verified
Q4: Use the table to answer the
Q4: To measure the population of lake trout
Q5: Which of the following is the best
Q7: Long-term studies of Belding's ground squirrels show
Q8: An ecologist recorded 12 white-tailed deer, Odocoileus
Q10: Suppose researchers marked 800 turtles and later
Q11: Use the figure to answer the
Q12: Use the graph to answer the following
Q14: Which of the following scenarios would provide
Q14: Use the graph to answer the following
Unlock this Answer For Free Now!
View this answer and more for free by performing one of the following actions

Scan the QR code to install the App and get 2 free unlocks

Unlock quizzes for free by uploading documents