
Use the graph to answer the following question.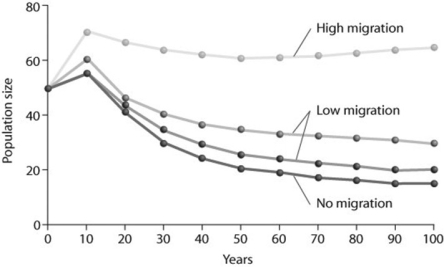
Looking at the figure, what factor is contributing significantly to stabilizing the population size over time?
I.no migration
II.low migration
III.high migration
A) only I
B) only II
C) only III
D) only II and III
Correct Answer:
Verified
Q1: Uniform spacing patterns in plants such as
Q4: To measure the population of lake trout
Q5: Which of the following is the best
Q9: Use the graph to answer the following
Q10: Suppose researchers marked 800 turtles and later
Q11: Use the figure to answer the
Q13: Which of the following is the most
Q14: Which of the following scenarios would provide
Q14: Use the graph to answer the following
Q15: Use the survivorship curves in the figure
Unlock this Answer For Free Now!
View this answer and more for free by performing one of the following actions

Scan the QR code to install the App and get 2 free unlocks

Unlock quizzes for free by uploading documents