Which of the illustrations of distribution curves demonstrates the least amount of variation in the scores? 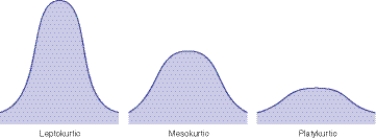
A) The least amount of variation would be in the first curve.
B) The least amount of variation would be in the second curve.
C) The least amount of variation would be in the third curve.
D) The amount of variation can't be defined by the curve.
Correct Answer:
Verified
Q3: A null hypothesis is stated. The null
Q4: A researcher conducts a statistical test that
Q5: If beta,
Q6: A researcher designs a study to
Q7: If a researcher wishes to predict with
Q9: A researcher states in an article that
Unlock this Answer For Free Now!
View this answer and more for free by performing one of the following actions

Scan the QR code to install the App and get 2 free unlocks

Unlock quizzes for free by uploading documents