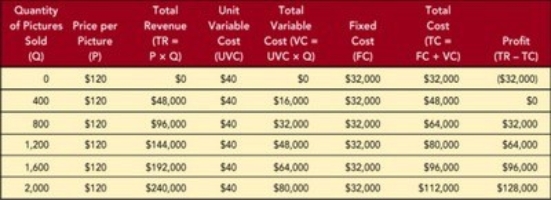
Solved

Figure 11-6 -A Break-Even Chart Is a Graphic Presentation

Question 234

Multiple Choice

  Figure 11-6 -A break-even chart is a graphic presentation A)  that shows the maximum number of units that will be sold at a certain price. B)  of a break-even analysis that shows where total revenue and total cost intersect to identify profit or loss for a given quantity sold. C)  that relates variable costs in terms of product or service substitutes in order to determine which items or services would least affect total revenues. D)  that relates profits and revenues versus total costs in order to determine the time frame in which a company could achieve profitability. E)  is a form of scatter graph used to identify specific activities or items that are creating the greatest return on investment. Figure 11-6
-A break-even chart is a graphic presentation


A) that shows the maximum number of units that will be sold at a certain price.
B) of a break-even analysis that shows where total revenue and total cost intersect to identify profit or loss for a given quantity sold.
C) that relates variable costs in terms of product or service substitutes in order to determine which items or services would least affect total revenues.
D) that relates profits and revenues versus total costs in order to determine the time frame in which a company could achieve profitability.
E) is a form of scatter graph used to identify specific activities or items that are creating the greatest return on investment.

Correct Answer:

verifed

Verified

Unlock this answer now
Get Access to more Verified Answers free of charge

Related Questions

Unlock this Answer For Free Now!

View this answer and more for free by performing one of the following actions

qr-code

Scan the QR code to install the App and get 2 free unlocks

upload documents

Unlock quizzes for free by uploading documents