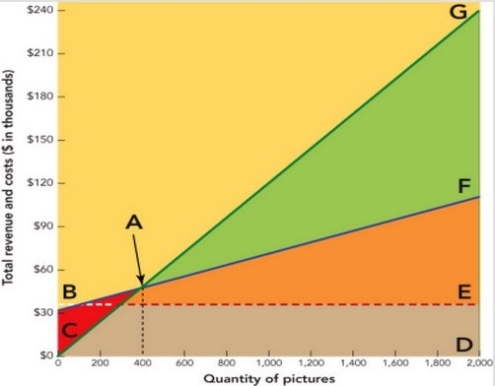
Solved

Figure 11-6a -In the Break-Even Chart in Figure 11-7a Above, the Triangular

Question 239

Multiple Choice

  Figure 11-6a -In the break-even chart in Figure 11-7a above, the triangular area GAF represents the firm's A)  fixed costs. B)  break-even point. C)  variable costs. D)  profit. E)  total revenue. Figure 11-6a
-In the break-even chart in Figure 11-7a above, the triangular area GAF represents the firm's


A) fixed costs.
B) break-even point.
C) variable costs.
D) profit.
E) total revenue.

Correct Answer:

verifed

Verified

Unlock this answer now
Get Access to more Verified Answers free of charge

Related Questions

Unlock this Answer For Free Now!

View this answer and more for free by performing one of the following actions

qr-code

Scan the QR code to install the App and get 2 free unlocks

upload documents

Unlock quizzes for free by uploading documents