Multiple Choice
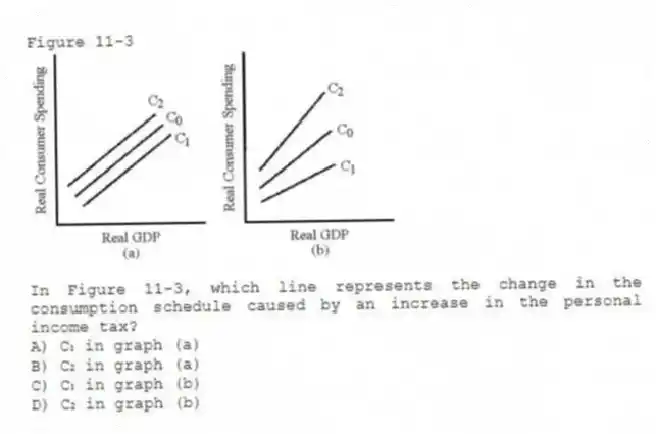
Figure 11-3
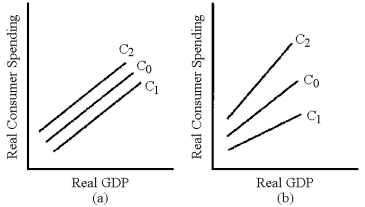
-In Figure 11-3, which line represents the change in the consumption schedule caused by an increase in the personal income tax?
A) C₁ in graph (a)
B) C₂ in graph (a)
C) C₁ in graph (b)
D) C₂ in graph (b)
Correct Answer:
Verified
Related Questions
Q182: As a general rule, when an income
Q186: When government increases a fixed tax, consumption

