Multiple Choice
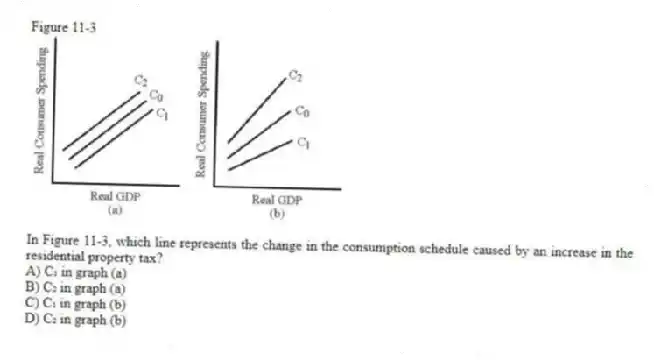
Figure 11-3
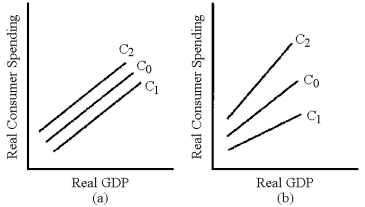
-In Figure 11-3, which line represents the change in the consumption schedule caused by an increase in the residential property tax?
A) C₁ in graph (a)
B) C₂ in graph (a)
C) C₁ in graph (b)
D) C₂ in graph (b)
Correct Answer:
Verified
Related Questions
Q184: Figure 11-3 Q186: When government increases a fixed tax, consumption Q187: Table 11-1 Q190: Table 11-1 Q191: In the short run, tax cuts that Q191: Figure 11-3 Q195: Explain why a change in income tax Unlock this Answer For Free Now! View this answer and more for free by performing one of the following actions Scan the QR code to install the App and get 2 free unlocks Unlock quizzes for free by uploading documents
![]()
![]()
![]()
![]()

