(Figure: Market for Enplanements) From the year 2000 to 2001, the demand curve for air travel shifted inward, from D2000 to D2001. In 2000, the equilibrium price and quantity were $122.22 and 148.9 million enplanements, respectively. In 2001, the equilibrium price and quantity fell to $104.82 and 123.6 million enplanements, respectively. The loss in producer surplus attributable to the decrease in demand is equal to area: 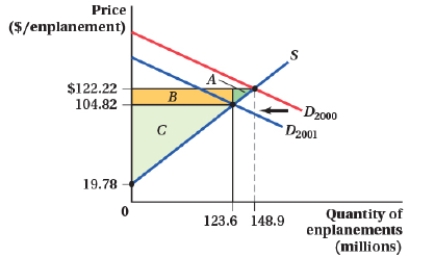
A) A.
B) A + B.
C) B + C.
D) B.
Correct Answer:
Verified
Q34: (Figure: Price and Quantity VII) The area
Q35: (Figure: Market for Ammunition I) Assuming the
Q36: (Figure: Market for Tickets I) Which of
Q37: Producer surplus can be calculated as:
A)
Q38: The demand and supply of ethanol (a
Q40: (Figure: Market for Snow Blowers I) The
Q41: (Figure: Price and Quantity VII) The area
Q42: To calculate consumer surplus for the case
Q43: Suppose that the demand curve for brown
Q44: The price elasticity of demand is -1.25,
Unlock this Answer For Free Now!
View this answer and more for free by performing one of the following actions

Scan the QR code to install the App and get 2 free unlocks

Unlock quizzes for free by uploading documents