(Figure: Price and Quantity VII) The area that represents consumer surplus with the demand curve D1 is _____, and the area that represents consumer surplus with the demand curve D2 is ____. 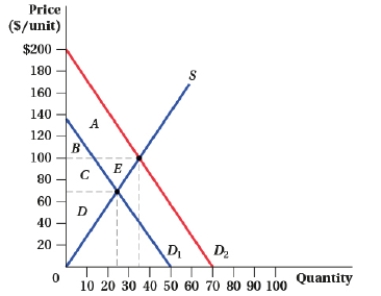
A) B; A + B
B) A + B; B + C
C) B + C; A + B + C + E
D) B + C; A + B
Correct Answer:
Verified
Q36: (Figure: Market for Tickets I) Which of
Q37: Producer surplus can be calculated as:
A)
Q38: The demand and supply of ethanol (a
Q39: (Figure: Market for Enplanements) From the year
Q40: (Figure: Market for Snow Blowers I) The
Q42: To calculate consumer surplus for the case
Q43: Suppose that the demand curve for brown
Q44: The price elasticity of demand is -1.25,
Q45: Suppose that last year the equilibrium price
Q46: Nancy paid $55 for car mats but
Unlock this Answer For Free Now!
View this answer and more for free by performing one of the following actions

Scan the QR code to install the App and get 2 free unlocks

Unlock quizzes for free by uploading documents