(Figure: Marginal Productivity of Apple Pickers I) Assume that the price per pound of apples has increased. Which graph best illustrates this change? 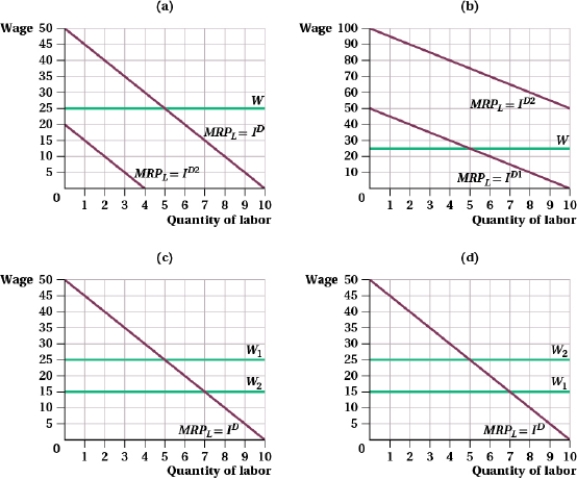
A) (a)
B) (b)
C) (c)
D) (d)
Correct Answer:
Verified
Q60: In the market for unimproved land, supply
Q61: Suppose the demand faced by a labor
Q62: A pizza shop's marginal product of labor,
Q63: Use your understanding of marginal revenue product
Q64: Assume that the initial short-run labor demand
Q66: (Table: Short-run Production Function I) The table
Q67: Assume that there has been an increase
Q68: A backward-bending labor supply curve occurs when:
A)
Q69: If the marginal expenditure for a monopsony
Q70: (Figure: Marginal Productivity of Apple Pickers I)
Unlock this Answer For Free Now!
View this answer and more for free by performing one of the following actions

Scan the QR code to install the App and get 2 free unlocks

Unlock quizzes for free by uploading documents