(Figure: Marginal Productivity of Apple Pickers I) Assume that there is a decrease in the wage paid to apple pickers. Which graph best illustrates this change? 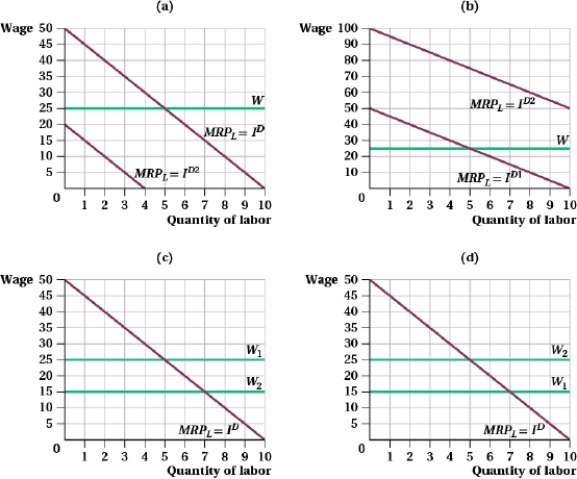
A) (a)
B) (b)
C) (c)
D) (d)
Correct Answer:
Verified
Q65: (Figure: Marginal Productivity of Apple Pickers I)
Q66: (Table: Short-run Production Function I) The table
Q67: Assume that there has been an increase
Q68: A backward-bending labor supply curve occurs when:
A)
Q69: If the marginal expenditure for a monopsony
Q71: (Figure: Market for Labor I) 
Q72: A union faces a labor demand curve
Q73: A pizza shop's marginal product of labor,
Q74: In the long run, a firm's decision
Q75: The marginal revenue product of labor is
Unlock this Answer For Free Now!
View this answer and more for free by performing one of the following actions

Scan the QR code to install the App and get 2 free unlocks

Unlock quizzes for free by uploading documents